A Beginner’s Guide to Data Engineering — The Series Finale
From ETL Pipelines To Data Engineering Frameworks

At Last, The Finale
From Part I of this series, we learned that a robust data foundation is an important prerequisite for pursuing analytics, be it business intelligence, experimentation, or machine learning. From Part II, we delved deeply into the specifics of Airflow and discussed techniques such as data modeling, star schema, and normalization. Furthermore, we walked through examples of data pipelines and covered ETL best practices. These are all important skills to learn to become an effective data scientist.
Typically, as companies climb up the hierarchy of data analytics and scale beyond a small team, complexity and development costs often increase. At Airbnb, we have more than 100+ contributors who authored Airflow pipelines. This makes enforcing ETL best practices, upholding data quality, and standardizing workflows increasingly challenging. Luckily, one of the antidotes to complexity is the power of abstraction. This principle, of course, is no exception when it comes to data engineering.
In data engineering, abstraction often means identifying and automating ETL patterns that are common in peoples’ workflows. In this final post, we will define the concept of a data engineering framework. We will dissect typical design patterns for building such frameworks, and finally, highlight a few specific examples we frequently use at Airbnb. By the end of this final post, I hope readers will be able to leverage the power of abstractions to build their own frameworks.
A Common Scenario
Suppose your company is now big enough to have several teams working on different parts of its product. Each team has its own OKR, product roadmap, and key performance indicators. As the embedded data scientist on the team, you are responsible for creating an analytics dashboard to track how the business is doing. You roll up your sleeves and get to work.
You start with data modeling and schema design. You identify relevant fact and dimension tables in order to calculate meaningful metrics organized by various useful dimensional cuts. You spend quite some time joining the tables to create a final denormalized table, and finally you backfill all the historical data. While this work is impactful, after working on a few dashboards, you have come to feel that the ETL workflow has become rather repetitive. In fact, many data scientists you talk to at the company are also creating dashboards using a similar workflow for their respective teams.
Not surprisingly, with product launches comes experiment deep dives — you carefully join an experiment assignment table with a fact table in order to aggregate user-level metrics. You compute test statistics from different treatment arms in order to calculate p-values and confidence intervals for your experiment. After talking to a few other data scientists, you once again realized that this is yet another workflow that is common among data scientists. In fact, it feels like a lot of what data scientists do on a day-to-day basis can be bucketed into a few distinct but common workflows.
This makes you wonder — is it possible to automate (at least partially) these workflows? The answer, is, of course, a resounding yes!
From Pipelines To Frameworks

As we have already learned from Part II, Airflow DAGs can be arbitrarily complex. Sometimes, the data computation even follows a control-flow like logic. For example, if you are interested in branching out the data flow after a specific conditional check, you can apply the BranchPythonOperator. If you want a workflow to continue only if a condition is met, you can use the ShortCircuitOpeartor. These operators, combined with the principle of configuration as code are what makes Airflow ETLs versatile and flexible. However, Airflow can do even more.
Our discussion so far has been limited to the design of a single, standalone pipeline, but we can apply the same principle to pipeline generation — a way to programmatically and dynamically generate DAGs on the fly. This is essentially what a data engineering framework does: it generates different instantiations of Airflow DAGs that automate data workflows. Here is how Maxime, the original author of Airflow, describes it:
To build workflows dynamically from code ... A very simple example would be an Airflow script that reads a YAML config file with a list of table names, and creates a little workflow for each table, that may do things like loading the table into a target database, perhaps apply rules from the config file around sampling, data retention, anonymization … Now you have this abstraction … you can create new chunks of workflows without doing much work. It turns out there are tons of use cases for this type of approach.
These tools are important because they enable data scientists to move up the data value chain much more quickly than they otherwise could.
- Imagine that when an experiment reporting framework auto-generates user-level metrics and computes statistics for an experiment, data scientists could now devote more time to analyzing changes in key metrics, interpreting user behavior, and highlighting the impact of product changes.
- Similarly, when a metrics framework automatically generates OLAP tables on the fly, data scientists can spend more time understanding trends, identifying gaps, and relaying product changes to business changes.
- Another example is a framework that abstracts away the engineering work required for productionizing an offline batch ML model. Data scientists no longer need to worry about package dependencies, setting up a virtual environment, or deployment. They can spend time on modeling instead.
The implication of these frameworks is profound because they drastically improve how data scientists work. These are precisely technologies that enable data scientists to provide value at scale.
Design Patterns For Data Engineering Frameworks
As useful as they are, DE frameworks are rarely born out of thin air. I once asked Airbnb’s first data engineer how he was able to create so many useful frameworks for everyone. His response was: “There really is no magic, when you have done certain task enough times, you started to see patterns that can be automated.” When you see your work as workflows, new possibilities arise.
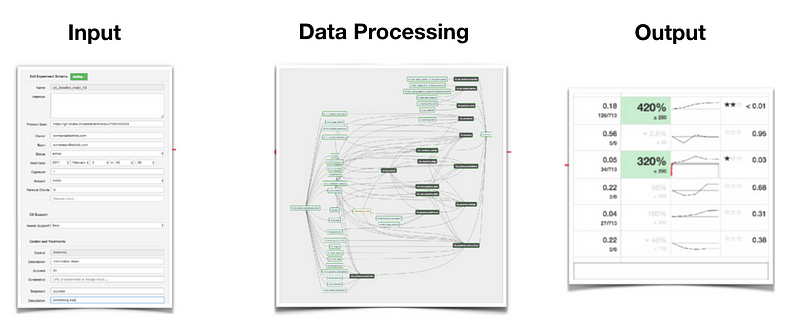
When thinking about which workflow to automate, the framework designer needs to start by thinking about the end user’s experience. There are generally three layers of a well-designed data engineering framework: the input layer, the data processing layer, and the output layer.
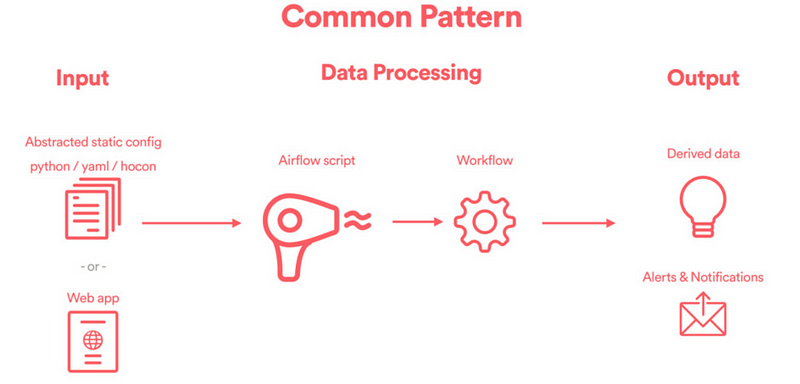
- Input: This is where an end user specifies how their DAGs should be configured. User experience really matters here. Typically, the input could be a static configuration file (e.g. YAML or HOCON), or it could be something as elaborate as a web UI. The goal here is to capture user needs.
- Data Processing: This is the core of any data engineering framework, where ETL pipelines are instantiated dynamically. The code that achieves this is generally referred to as a DAG factory, which whimsically captures the notion that DAGs are being created one at a time, like in a factory.
- Output: The DAGs generated from the previous step create derived data, and the output is often saved in a downstream Hive table, presented in a well-designed UI / visualization layer, or simply consumed by downstream pipelines or frameworks.
This might all sound rather abstract. Therefore, in the next few sections, I will highlight specific examples that we leverage at Airbnb to make this more concrete. When reading the sections below, keep in mind which workflow each framework is trying to automate and pay attention to the input and output layers of the framework.
1. Incremental Computation Framework
It is quite common for data scientists to calculate computationally intensive metrics like a cumulative sum or the time since the first or last event. For example, we might wish to report the total number of users who ever engaged with a new product or to compute a histogram of days since users have last returned. The naive approach would be to query a fact table and take the sum, max, or min over all date partitions in order to calculate these desired metrics. However, this querying pattern is rather inefficient.
Why? This solution violates the ETL principle of load data incrementally since the required computation scans the entire fact table. Ideally, we would build a summary table to pre-compute these metrics so an end-user only needs to reference the metric in a single or latest date partition of the summary table. This pattern is so common that our data engineer built a framework called Incremental Computation Framework.
- Input: A HOCON configuration file where a user specifies which metrics or events to pre-compute, which subject key to group by, and which fact table to query from in order to build the summary table.
- Data Processing: An Airflow script that builds the summary table incrementally: namely, union the summary table from the previous date partition with today’s fact table to update the expensive metrics:
cumsum_metric_today = f(cumsum_metric_yesterday, metric_today), where f can be a sum, min/max, or any other aggregation functions. - Output: Optimized summary table where cumulative sum, days since first / last event or other expensive metrics can be queried from one and only one single date partition from the summary table.
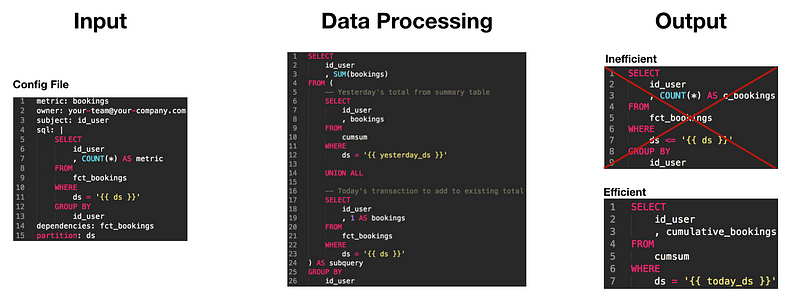
What workflow does this framework automate? It helps users to avoid inefficient querying patterns and automates away the tedious aggregation that we otherwise would need to do, one date partition at a time.
2. Backfill Framework
As we have already discussed in Part II, backfilling is an important but time-consuming step in any data engineering work. Once an ETL pipeline is built, we need to retrospectively visit earlier data in order to reconstruct history. Some of the backfilling strategies we have discussed include dynamic partitions and baking backfill logic into SQL using Jinja templates. However, even with these techniques, backfilling can still be tedious. An engineer once told me: “I do not ever want to hear the word backfill again”, which gives you some idea how tedious backfilling can be :)
For example, if we need to backfill a few years worth of data, it would be much more efficient to break and parallelize such a task into mini-backfills. However, managing these long-running parallel processes can be rather cumbersome. In addition, we often need to perform sanity checks before inserting backfilled data into a production table. Given that backfilling is such a common but far too often unpleasant experience, we built a Backfill Framework to automate this workflow:
- Input: A simple UI where users can specify the job name, the
start_dateandend_dateof the backfill job, how many processes we want to parallelize the backfill for, and how many days each process should backfill for. - Data Processing: Once a user specifies how the backfill job would be run, the framework creates a Airflow pipeline that automatically parallelizes the backfill tasks, performs sanity-checks, and swaps staging tables with production tables.
- Output: A fully backfilled table ready for consumption.
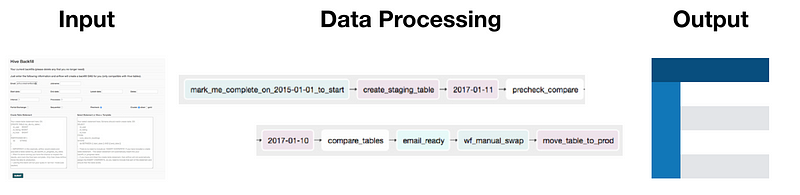
What workflow does this framework automate? It automates away many of the ad-hoc backfilling scripts people have to run on their own machines. It automates quality assurance by setting up automatic comparison. Finally, it swaps the staging table with the production table after QA tests.
3. Global Metrics Framework
Up until recently, data scientists at Airbnb spent quite a lot of time when it came to building ETLs for analytics and dashboards. As we discussed earlier, a lot of work here is to identify the correct data sources, to define metrics and dimensions, and to create the final denormalized tables. While different teams might have different key performance metrics and, as a result, different fact tables, important dimensions for the business are usually quite consistent and slowly changing.
For example, data scientists who work on the host-side of the marketplace typically care about dimensional cuts such as the listing’s market, type, or capacity. Similarly, data scientists on the guest-side care about dimensions such as guest stage, origin market, or destination market. With this insight, it became clear that a lot of ETL pipelines actually involved joins of many fact tables with a much smaller set of dimension tables. This is what motivated the creation of Global Metrics Framework.
- Input: A much more involved HOCON configuration file that specifies one or more metrics in an atomic fact table, dimension sets that one wishes to include in the final table, primary keys and foreign keys to be used for joins, and a slew of other useful information to track table creations.
- Data Processing: The framework identifies the metrics and the dimensional cuts that it needs to aggregate and cut by, joins the dimension tables with the atomic fact tables to create the denormalized tables automatically.
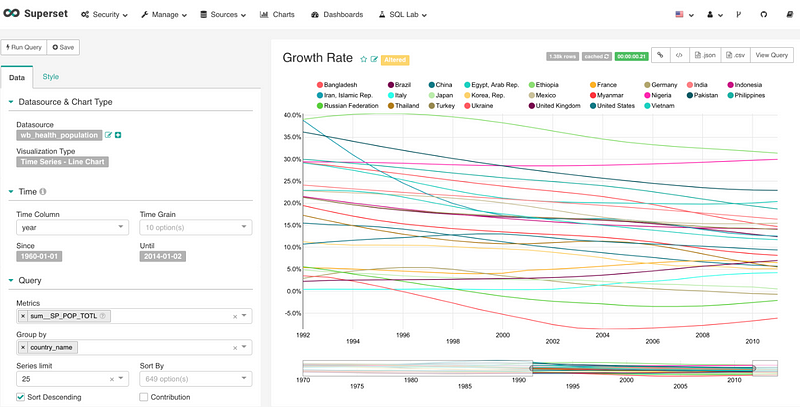
- Output: One or more Hive tables with the same set of metrics but possibly different sets of dimensions are created. This means that one or more denormalized tables can be created on the fly, and all these data sources are further made available in Druid for visualization in Superset.
Source: Airbnb’s metrics framework talk, presented by Lauren Chircus during DataEngConf18
What workflow does this framework automate? It automates away the common data engineering work that is required for the creation of denormalized tables that can be later used for dashboards, analytics, and more. The product manager of this project called it the “Denormalization Machine”.
4. Experimentation Reporting Framework
Many of the data-driven technology companies have built their own internal experimentation platforms, and Airbnb is no exception. Given that I had worked on a similar team at Twitter, I can appreciate how complex ETL in experimentation pipelines can be. They often involve several modular DAGs, each consisting of thousands of tasks.
Despite its complexity, our experimentation reporting framework actually follows the same design pattern described above. The only difference here is that each layer is far more complex than the layers mentioned in all the examples earlier. However, such an investment is often worthwhile and even necessary, because it enables product teams in the company to run hundreds or thousands of experiments concurrently without needing to hire hundreds or thousands of data scientists.
- Input: Instead of a simple configuration file or a simple UI, a fully fledged UI is built here so users can specify the type of experiment to run, which target or secondary metrics to track, what are the experiment buckets and their relative sizes, etc. Anything that is relevant for launching and computing the experiment data is captured in this step.
- Data Processing: The metrics pipeline that computes, for each experiment, the subject-level metrics and their corresponding dimensions. The sheer combinations of these metrics and dimensions are what makes the computation super complex. In fact, it is often the case that experimentation pipelines are the most complex ETL job at a company.
- Output: Instead of a simple output table, there is a lot of downstream processing involved in this step. For example, statistics such as p-value, confidence interval, significance, and minimum detectable effect are calculated here. Depending on the maturity of the reporting framework, users might be able to do metrics capping or variance reduction. Each step requires a separate calculation before being served in the final UI.
What workflow does this framework automate? The hundreds and thousands of experiment deep dives that data scientists otherwise need to carry out.
Conclusion

By now, I hope you have come to appreciate the power of abstraction in DE frameworks. These frameworks are incredible multipliers to data scientists’ work and workflow. It was really mind-blowing when I learned about how much of my day-to-day work can be abstracted away. As a strong believer of the philosophy that analytics are built upon layers, I see these frameworks as the foundational pieces that need to be in place first. With more and more of these frameworks shared and discussed, I am curious what our work will look like in the next few years to come.
That’s it for the series: if you have gotten this far, I want to congratulate you for learning the basics of data engineering. More importantly, thank you for reading along. As I mentioned many times, none of these ideas are my own, but I was really fortunate to learn these concepts from some of the best data engineering talents today. Given that data engineering is a very important but often under-appreciated area, I hope I have done a small part in advocating for it! If you are intrigued by this series and want to learn more about data engineering and specifically Airflow, I would recommend starting with this list of resources.
Keep learning, and happy data engineering!
I want to thank once again my friend Jason Goodman for providing feedback for this series. All third party trademarks in this post are the property of their respective owners. Special thanks to Max, Arthur, Aaron, Michael, and Lauren for teaching me (directly or indirectly) all things Data Engineering related.

If you find my writing helpful, please support me by donating or buying me a coffee!


Comments ()